


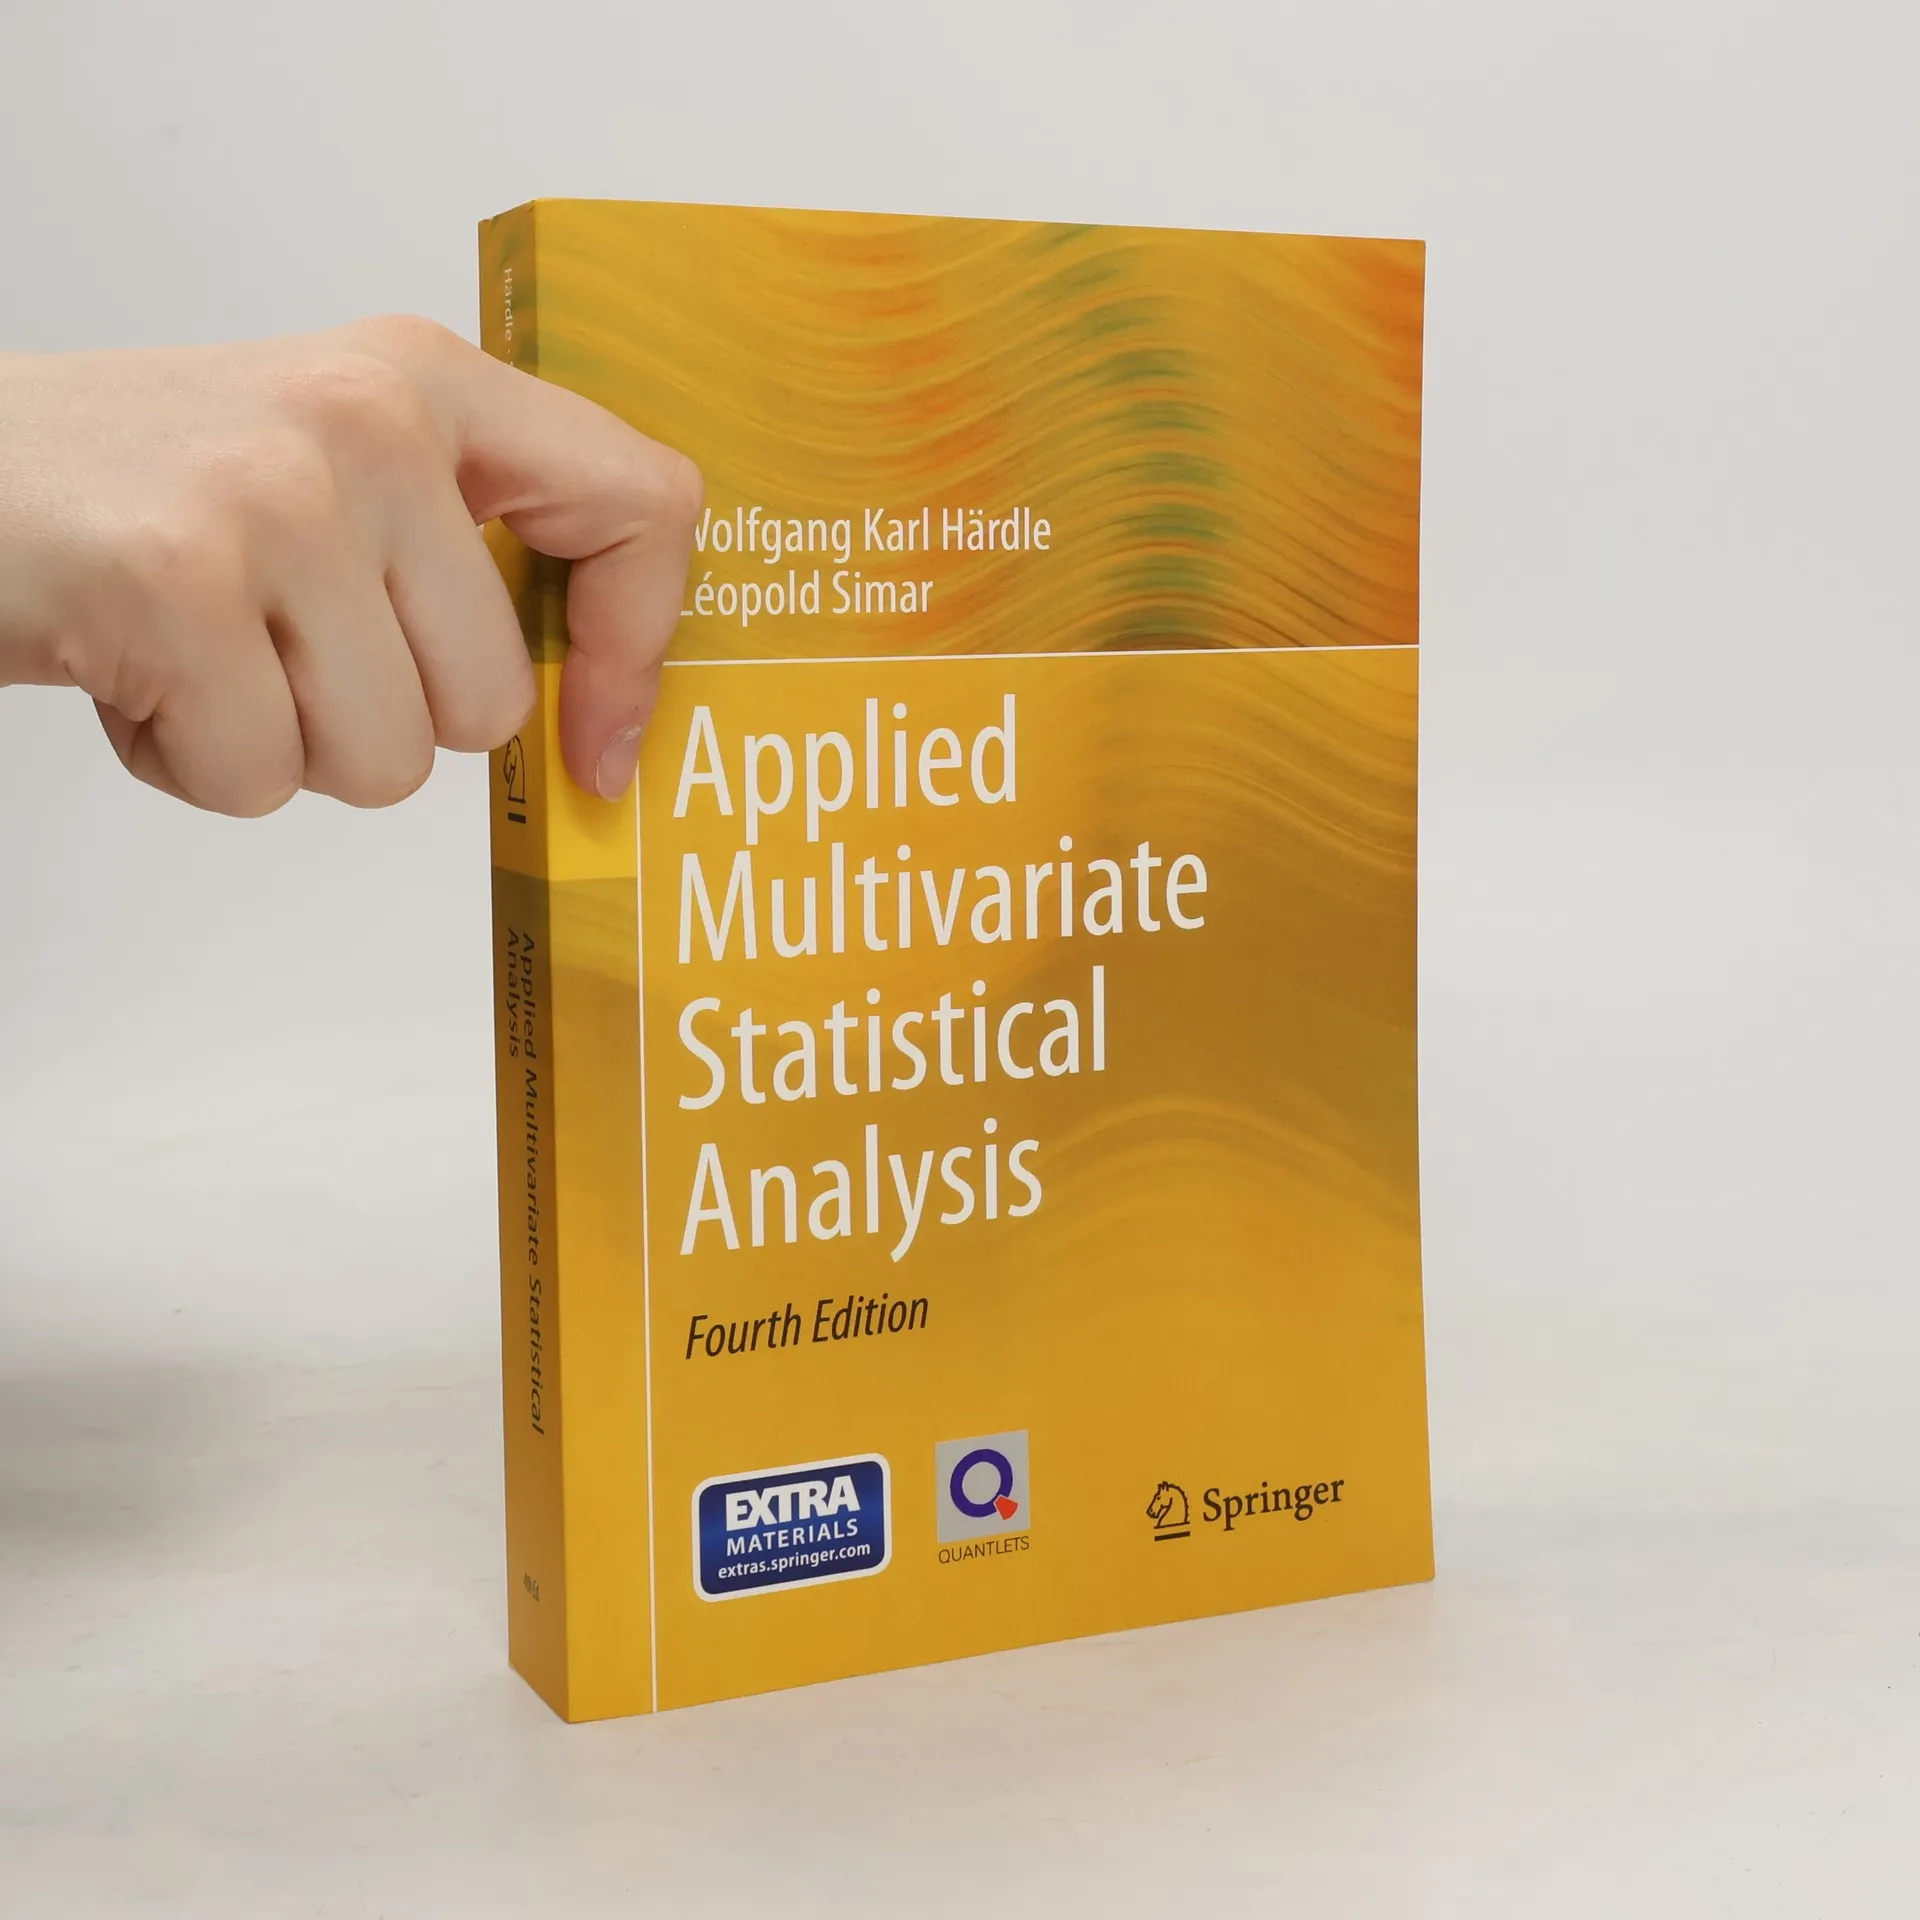
Applied multivariate statistical analysis
- 580 Seiten
- 21 Lesestunden
Focusing on high-dimensional applications, this 4th edition presents the tools and concepts used in multivariate data analysis in a style that is also accessible for non-mathematicians and practitioners. It surveys the basic principles and emphasizes both exploratory and inferential statistics; a new chapter on Variable Selection (Lasso, SCAD and Elastic Net) has also been added. All chapters include practical exercises that highlight applications in different multivariate data analysis fields: in quantitative financial studies, where the joint dynamics of assets are observed; in medicine, where recorded observations of subjects in different locations form the basis for reliable diagnoses and medication; and in quantitative marketing, where consumers' preferences are collected in order to construct models of consumer behavior. All of these examples involve high to ultra-high dimensions and represent a number of major fields in big data analysis. and Hlavka, Z., Multivariate Statistics: Exercises and Solutions. Springer Verlag, Heidelberg